1kHz Real-Time Robot Control System Monitoring Architecture
When collecting performance data from a 1kHz real-time control loop, you face a dilemma:
| RT Loop Requirements | Monitoring Requirements |
|---|---|
| Deterministic execution | Data storage (memory/disk I/O) |
| No memory allocation | Network transmission (ROS2 publishing) |
| No blocking calls | Statistics calculation |
| No exception handling | Visualization |
This article designs a monitoring architecture that collects high-resolution performance data while maintaining RT determinism.
Architecture Overview
Core Pattern: RT/Non-RT Producer-Consumer
- Producer: RT thread pushes data to lock-free queue (no blocking)
- Consumer: Non-RT thread polls queue and publishes to ROS2 topics
Why Thread Separation? (Instead of Process Separation)
| Aspect | Thread Separation | Process Separation |
|---|---|---|
| Memory sharing | Direct heap memory access | IPC required |
| Latency | Microsecond level | Additional IPC overhead |
| Lifecycle management | Single process | Multiple processes |
Data Structures
RtSample (216 bytes)
Complete RT cycle data for each 1ms period:
| Category | Data | Bytes | Purpose |
|---|---|---|---|
| Timing | monotonic_ns, sequence | 16 | Sequence tracking |
| Loop Performance | loop_exec_us, loop_period_us, loop_jitter_us, deadline_miss | 17 | RT performance analysis |
| Joint State | 6-axis actual/cmd (position, velocity, torque) | 144 | Control quality evaluation |
| Drive State | CiA 402 status_word, control_word, op_mode | 30 | Servo diagnostics |
| Fieldbus | wkc, wkc_mismatch, link_error | 4 | Communication stability |
Constraint: Must be trivially_copyable for lock-free queue operations.
Event (64 bytes, Cache-line aligned)
Structure for event-based notifications:
struct alignas(64) Event {
    // Classification (4 bytes)
    EventType type;
    uint8_t source_id;
    EventSeverity severity;
    uint8_t joint_id;

    // Timing (24 bytes)
    uint64_t monotonic_ns;
    uint64_t event_sequence;
    uint64_t ref_sample_seq;

    // Data (24 bytes)
    int32_t error_code;
    uint8_t extra_len;
    uint8_t extra[21];

    // Numeric (4 bytes)
    float value;

    // Padding (8 bytes) - 64-byte alignment
};
Lock-Free SPSC Queue
Implementation Choice: rigtorp::SPSCQueue
- Wait-free: Producer performs at most 2 atomic loads on 64-bit Linux
- False sharing prevention: 64-byte cache line alignment
// Cache line alignment to prevent False Sharing
static constexpr size_t kCacheLineSize = 64;

alignas(kCacheLineSize) std::atomic<size_t> writeIdx_ = {0};  // Only Producer writes
alignas(kCacheLineSize) size_t readIdxCache_ = 0;              // Producer local cache
alignas(kCacheLineSize) std::atomic<size_t> readIdx_ = {0};    // Only Consumer writes
alignas(kCacheLineSize) size_t writeIdxCache_ = 0;             // Consumer local cache
Performance Benchmark (100,000 iterations, Release -O2)
| Operation | Mean | P99 | Notes |
|---|---|---|---|
| RtSample creation + queue push | 0.3 us | 0.7 us | 216B struct |
| Event creation + queue push | ~0.1 us | 0.3 us | 64B struct |
| Memory usage (queue) | 1.8 MB | - | 8192 samples + 512 events |
Total monitoring overhead: < 0.05% of 1ms period
ROS2 Topic Design (3-Tier)
| Topic | Frequency | QoS | Purpose |
|---|---|---|---|
/rt_raw | 1kHz | best_effort, depth=200 | Full recording, post-analysis |
/rt_events | On event | reliable + transient_local, depth=50 | Event notifications |
/rt_monitor_stats | 10Hz | reliable, depth=20 | Real-time health dashboard |
Decimation (1kHz to 10Hz)
// /rt_raw publishes every sample (1kHz)
rt_raw_pub_->publish(to_rt_raw(sample, now));
sample_count_++;

// /rt_monitor_stats uses 100:1 decimation (10Hz)
if (sample_count_ % 100 == 0) {
    publish_stats();
}
Edge Detection (Preventing Duplicate Events)
// Rising edge detection: emit event only when current=true && previous=false
const bool faulted = servo.faulted;
if (faulted && !prev_faulted_) {
    emit(EventType::SERVO_FAULT, ...);
}
prev_faulted_ = faulted;
Cooldown Mechanism (Preventing Event Storms)
Continuous events like deadline misses can generate thousands of events in a short time. To prevent this, apply a 100ms cooldown:
// Ignore same event type if it occurs within 100ms
constexpr auto kEventCooldown = std::chrono::milliseconds(100);

if (now - last_event_time_[type] > kEventCooldown) {
    emit(type, ...);
    last_event_time_[type] = now;
}
Storage and Visualization
MCAP Format
- Native PlotJuggler support
- Efficient time-based indexing
- Compression options (zstd, lz4)
When recording the /rt_raw topic published with best_effort QoS, it may conflict with rosbag2's default QoS (reliable). Use a QoS override file:
# qos_override.yaml
/rt_raw:
  reliability: best_effort
  history: keep_last
  depth: 200
ros2 bag record /rt_raw /rt_events --qos-profile-overrides-path qos_override.yaml
Storage Capacity Calculation
| Topic | Calculation | Hourly Storage |
|---|---|---|
/rt_raw | 1kHz x ~250B x 3600s | ~1.0 GB |
/rt_events | Variable based on event frequency | 10-50 MB |
/rt_monitor_stats | 10Hz x 80B x 3600s | ~3 MB |
| Total | ~1.0-1.1 GB |
Rolling Retention (External Script)
Two-stage cleanup policy for unlimited operation:
# Time-based: Delete files older than 60 minutes
cleanup_old_files() {
    find "$BAG_DIR" -name "*.mcap" -mmin +"$RETENTION_MIN" -delete
}

# Capacity-based: FIFO deletion when disk usage exceeds 70%
cleanup_disk_space() {
    # Delete oldest files first
}
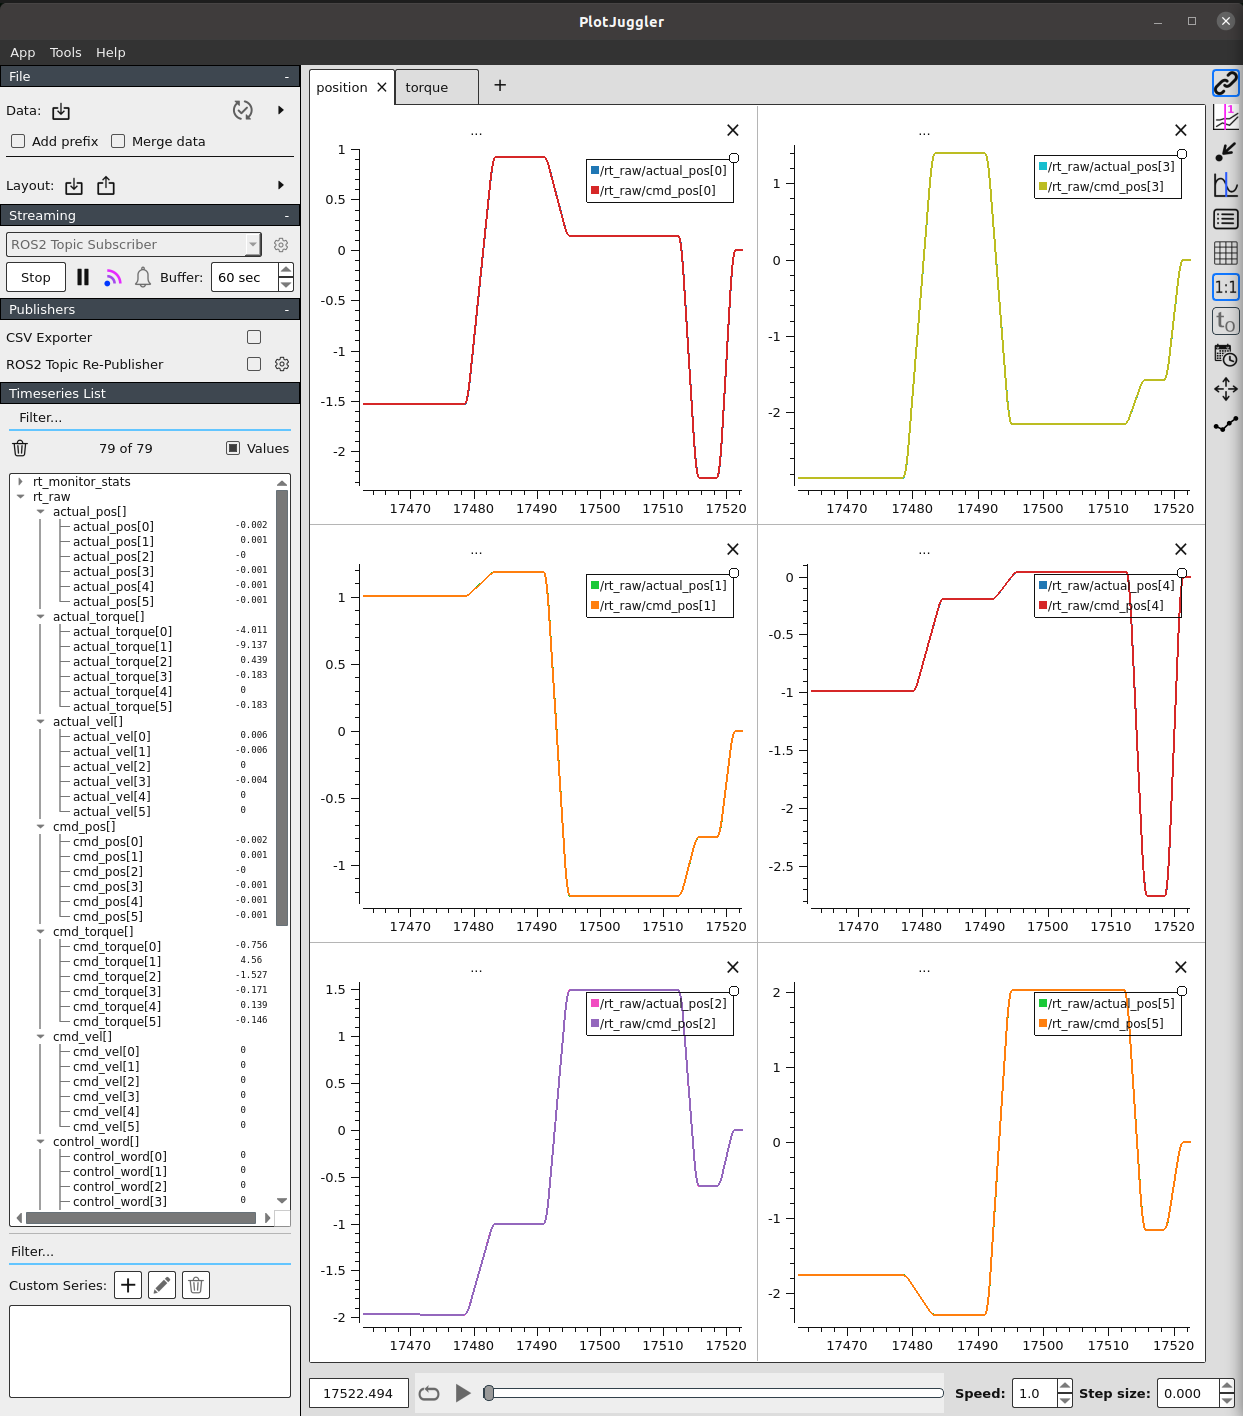
PlotJuggler Configuration

Real-time visualization of 6-axis joint actual_pos vs cmd_pos using PlotJuggler
Streaming Mode Settings:
- Mode: ROS2 Topic Subscriber
- Time Window: 180 seconds (3-minute rolling)
- Max Points: 20,000
monotonic_ns, sequence, and other uint64 fields may cause truncation errors in PlotJuggler. Exclude these fields from visualization.
Monitoring Health Metrics
Self-Monitoring
| Field | Meaning | Warning Threshold |
|---|---|---|
rt_queue_fill_pct | SPSC queue utilization | > 70% |
rt_overflow_delta | Queue overflow count | > 0 |
publisher_lag_ms | RT to Non-RT propagation delay | > 50ms |
seq_gap_count_delta | Lost sample count | > 0 |
Operational Thresholds
| Metric | Normal | Warning | Critical |
|---|---|---|---|
| rt_queue_fill_pct | < 50% | > 70% | > 90% |
| publisher_lag_ms | < 10ms | > 50ms | > 100ms |
| loop_jitter_us (P99) | < 50us | > 100us | > 200us |
| seq_gap_count | 0 | > 0 | - |
Operational Recommendations
This monitoring system is designed for development and debugging purposes.
| Situation | Recommendation |
|---|---|
| Development environment | Enable PlotJuggler real-time visualization |
| Production | Disable 1kHz topic publishing or enable only when needed |
| When issues occur | Enable monitoring to analyze root cause |
Note: PlotJuggler real-time visualization consumes significant CPU resources. 1kHz topic publishing can also cause system load.
Key Takeaways
-
RT/Non-RT Separation: Lock-free SPSC Queue maintains RT thread determinism while transferring data to Non-RT thread.
-
3-Tier Topic Design: Optimize QoS for each purpose.
/rt_raw(1kHz): Full recording/rt_events: Event notifications/rt_monitor_stats(10Hz): Dashboard
-
Lock-free Queue Performance: RtSample push takes 0.3us, less than 0.05% overhead of 1ms period.
-
MCAP Rolling Retention: External scripts for time/capacity-based cleanup support unlimited operation.
-
Self-Monitoring: Track queue utilization, latency, and lost samples to verify the health of the monitoring system itself.
-
Development Tool: Use PlotJuggler and 1kHz publishing only in development environments; enable in production only when needed.